The solar industry is a big job creator. But the number of solar jobs in the U.S. shrank slightly in 2017, the first decline since tracking of solar jobs began in 2010 with The Solar Foundation’s first annual Solar Jobs Census.
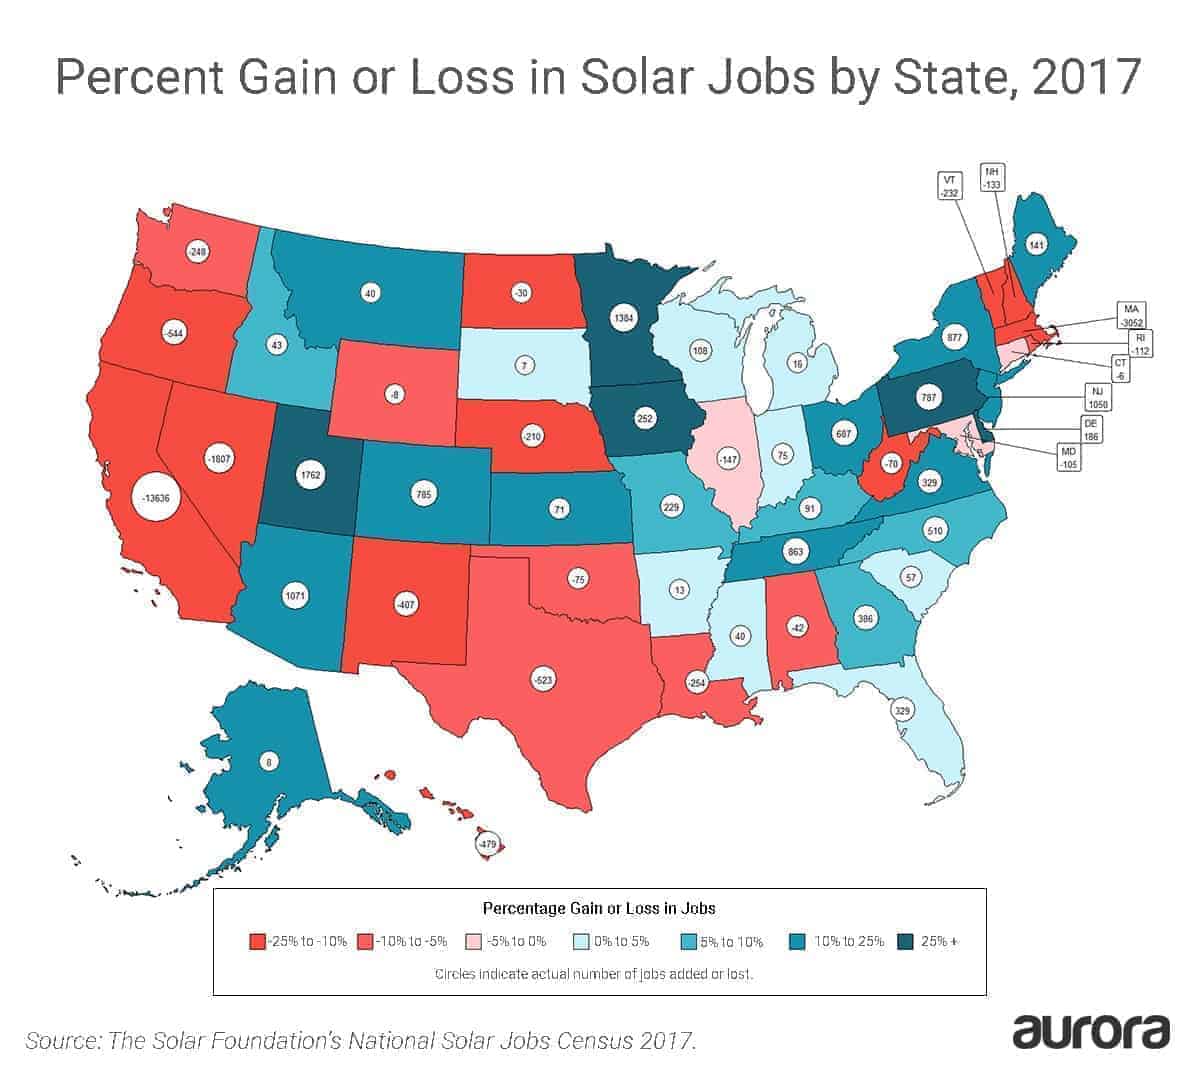
However, solar industry performance varied widely by state. While some traditionally strong state markets like California and Massachusetts saw notable declines in solar employment, there were also many bright spots: 29 states added solar jobs last year.
In today’s article, we dig into the results of The Solar Foundation’s 2017 Solar Jobs Census to see which states achieved solar job growth and which states saw contraction in the solar industry.
National and Long-Term Trends
It’s well known that 2017 was a tougher year for the industry than record-breaking 2016. In its 2017 Solar Census The Solar Foundation confirmed that, finding that solar industry employment declined by 3.8% (or 9,800 jobs) in 2017.
There were a variety of factors that likely influenced decline. One was a so-called “hangover” from 2016, in which record numbers of solar projects were completed to take advantage of the Investment Tax Credit, which was anticipated to expire at the end of the year. Another was uncertainty over the outcome and impacts of the solar trade case brought by Sunniva and SolarWorld Americas under Section 201 of the Trade Act of 1974 (which President Trump issued a ruling on in January).
Additionally, challenges in states that have traditionally been leaders in solar, particularly California, contributed to the overall decline. In fact, The Solar Foundation reports that “if California were removed from the 2017 Census, the nation would have experienced solar job growth.”
Discussing the findings, President and Executive Director of The Solar Foundation, Andrea Luecke, noted “After six years of rapid and steady growth, the solar industry faced headwinds that led to a dip in employment in 2017, including a slowdown in the pace of new solar installations. At the same time, the fact that jobs went up in 29 states is an encouraging sign that solar is taking hold across the country as a low-cost, sustainable, and reliable energy source.”
So where did solar jobs grow in 2017? Let’s take a look.
States with the Greatest Solar Job Growth in 2017
More than half of U.S. states added jobs in 2017. Among the states that saw the greatest gains in solar jobs were (in order of growth) Utah, Minnesota, Arizona, New Jersey, and New York.
1. Utah: 1,762 solar jobs added in 2017
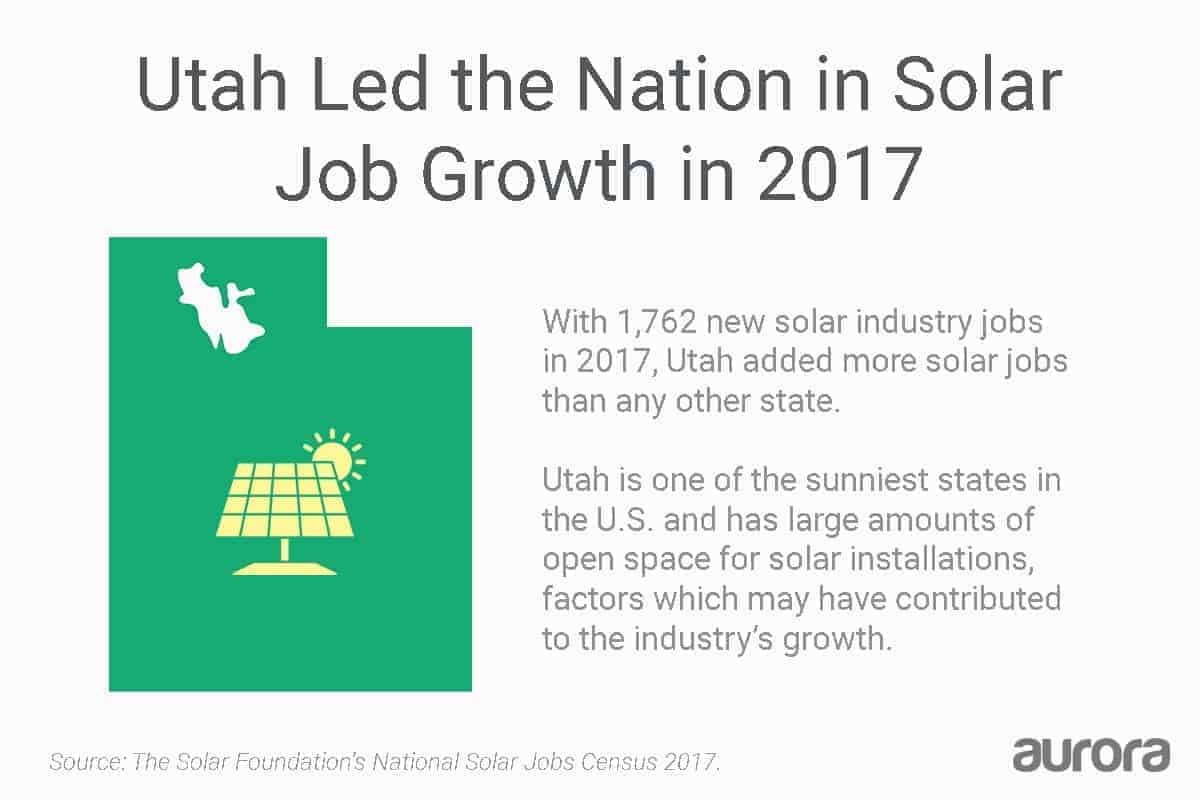
Utah led the nation in solar job growth in 2017, adding 1,762 new solar jobs. Factors in Utah’s strong solar economy include the state’s climate and geography, and the falling costs of solar deployment (SEIA reports solar prices have fallen 55% in Utah in the last 5 years). Discussing the industry’s growth, the Salt Lake Tribune notes that Utah “ranks as the fifth-sunniest state in the nation, and there’s a lot of wide, empty land available for building solar farms.”
2. Minnesota: 1,384 solar jobs added in 2017
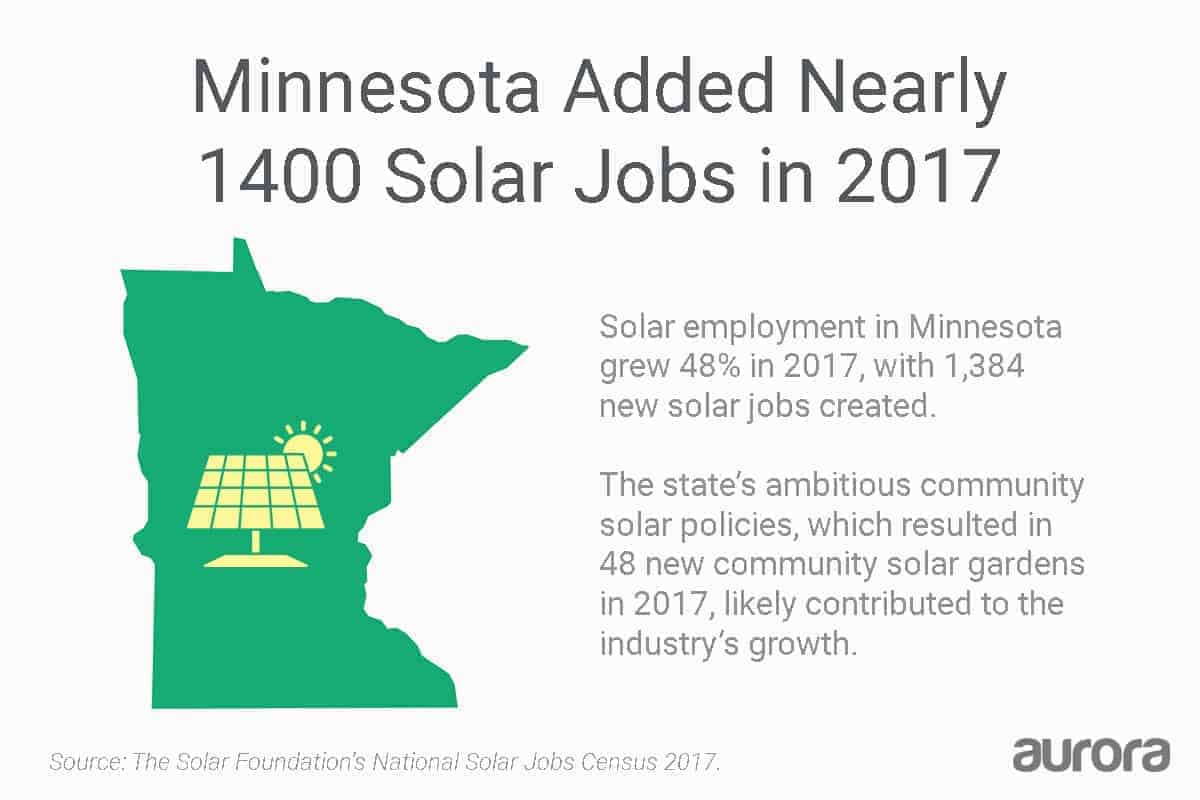
Minnesota’s solar job gains are particularly striking, with solar jobs growing 48% in the last year (a growth rate only exceeded by Delaware at 51%). One factor in this growth was the state’s mandated community solar program. Under the program 48 community solar gardens were developed in Minnesota in 2017, reaching 170 MW of community solar in November 2017.
John Farrell, director of the Energy Democracy Initiative at the Institute for Local Self-Reliance, points out that a key difference between Minnesota’s community solar policies and those of other states is that Minnesota has no cap on community solar capacity. As a result, the future of community solar in the state looks strong . Farrell notes “There [are] 10 times more community solar projects in the queue—400 MW—in Minnesota than have been built in the history of community solar in the United States (outside Minnesota).”
3. Arizona: 1,071 solar jobs added in 2017
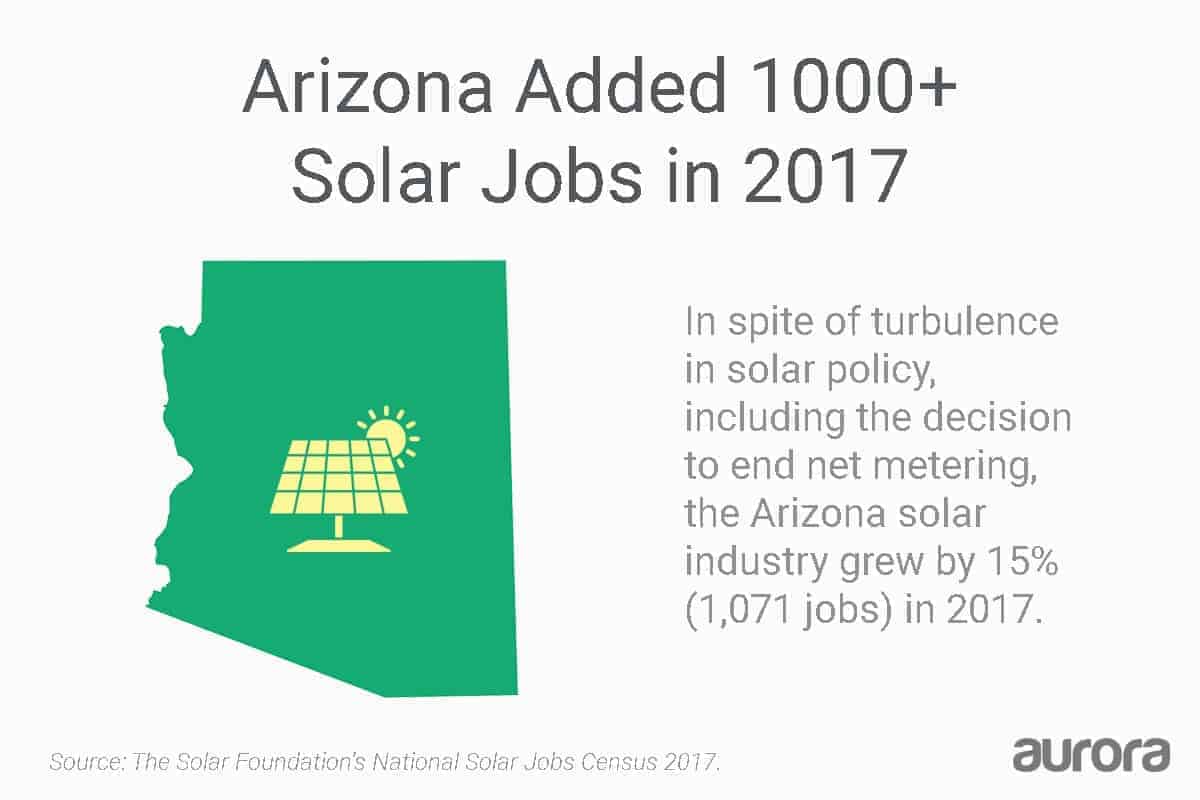
Despite policy turbulence in Arizona, including the decision to end retail net metering in December 2016 and replace it with a new, less favorable compensation policy, the Arizona solar industry grew by 15% in 2017, adding over 1000 additional jobs. SEIA notes that Arizona is one of the sunniest states in the nation with huge potential for solar growth, which may have played a role.
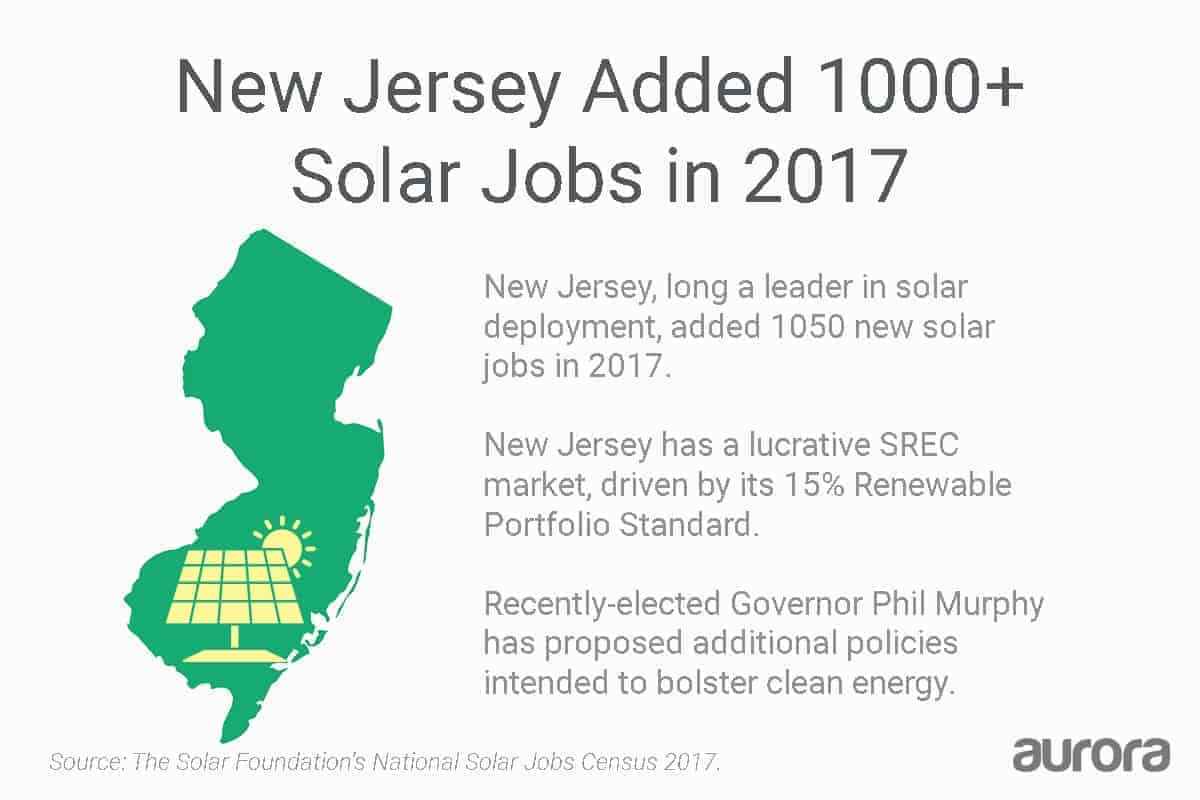
4. New Jersey: 1,050 solar jobs added in 2017
New Jersey has long been a leader in solar energy and 2017 was no different. The state, which is fifth in the nation for solar capacity despite its small size, added 1050 solar jobs in 2017, growing 17%.
New Jersey has a renewable portfolio standard that requires utilities to source 15% of electricity from renewable sources. The program provides the basis for a lucrative SREC market in which solar energy producers can sell credits for the energy they produce.
The future of solar in New Jersey looks bright, as well. New Jersey’s recently elected governor, Phil Murphy, has proposed the creation of a green bank, which the Environmental Defense Fund reports could significantly bolster investment in clean energy (as has been the case in nearby Connecticut and New York, which both have active green banks). Additionally, Murphy was elected on a platform that includes plans to source 100% of New Jersey’s energy from renewable sources by 2050.
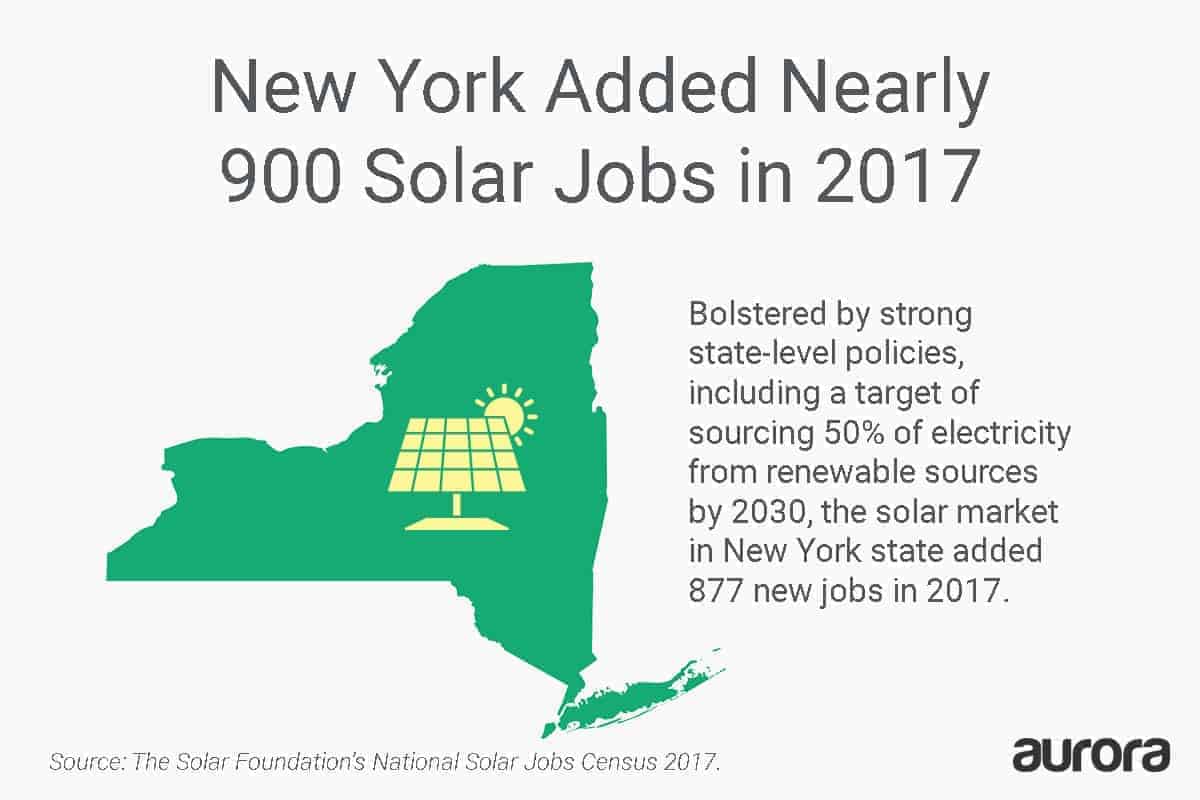
5. New York: 877 solar jobs added in 2017
Solar in New York state has grown by 1000% since 2011 , aided by strong state-level policies supporting solar energy and other renewables. In 2017, New York added nearly 900 new solar jobs. The state has a target of sourcing 50% of its electricity from renewable sources by 2030, and has an active green bank that is making financing for solar projects more accessible.
Other states with notable increases in solar jobs include Tennessee (863 new jobs, a 24% increase), Pennsylvania (787 new jobs, a 26% increase), Colorado, Ohio, and North Carolina. Delaware and Iowa showed remarkable increases in solar jobs as a percentage of total industry employment, growing 51% and 45% respectively.
What States Lost the Most Solar Jobs in 2017?
1. California: 13,636 solar jobs lost in 2017
California, which has a larger solar industry—both in terms of employees and installed capacity—than any other state, experienced the largest declines in solar employment in 2017. With 13,636 solar jobs lost in 2017, California’s job losses alone exceeded the 12,311 combined jobs added in other states that saw solar job growth.
However, given the size of the solar industry in California, this was only a 14% contraction in the job market. In California, 86,414 people are employed in solar, dwarfing employment in the next largest state market, Massachusetts, where 11,530 were employed at the time of the 2017 Solar Census.
The Solar Foundation points to a number of factors that contributed to this decline in California solar employment. In addition to the so-called “hangover” from 2016’s epic solar growth, a rainy 2017 dampened solar sales. Additionally, the Census cites changes to time of use rates in California as a factor; reporting that these new utility rates, which vary the cost of energy depending on the time of day, can make it harder to explain the economics of a solar project to prospective customers.
2. Massachusetts: 3,053 solar jobs lost in 2017
Solar employment in Massachusetts declined 21% last year, a loss of 3,053 jobs. The Boston Globe notes that potential contributing factors include: “uncertainty about changes in solar incentives; caps in some parts of the state on new net metering credits; and concern over a new charge on solar users imposed by [regional utility] Eversource.”
3. Nevada: 1807 solar jobs lost in 2017
The solar industry in Nevada is still recovering from dramatic job losses that resulted from the state’s decision to eliminate net metering in December 2015. Although the state reinstated net metering (at a lower rate) in June 2017, helping to revive the market, it was “not enough to make up for the previous losses,” said Ed Gilliland, Senior Director at The Solar Foundation in remarks to Greentech Media. “At least not yet.”
Despite the slight national decline in solar employment in 2017, more than half of state markets showed job growth and long-term trends for solar’s growth remain bright. In 2018, the solar industry is expected to return to the year-over-year growth that has characterized the sector.
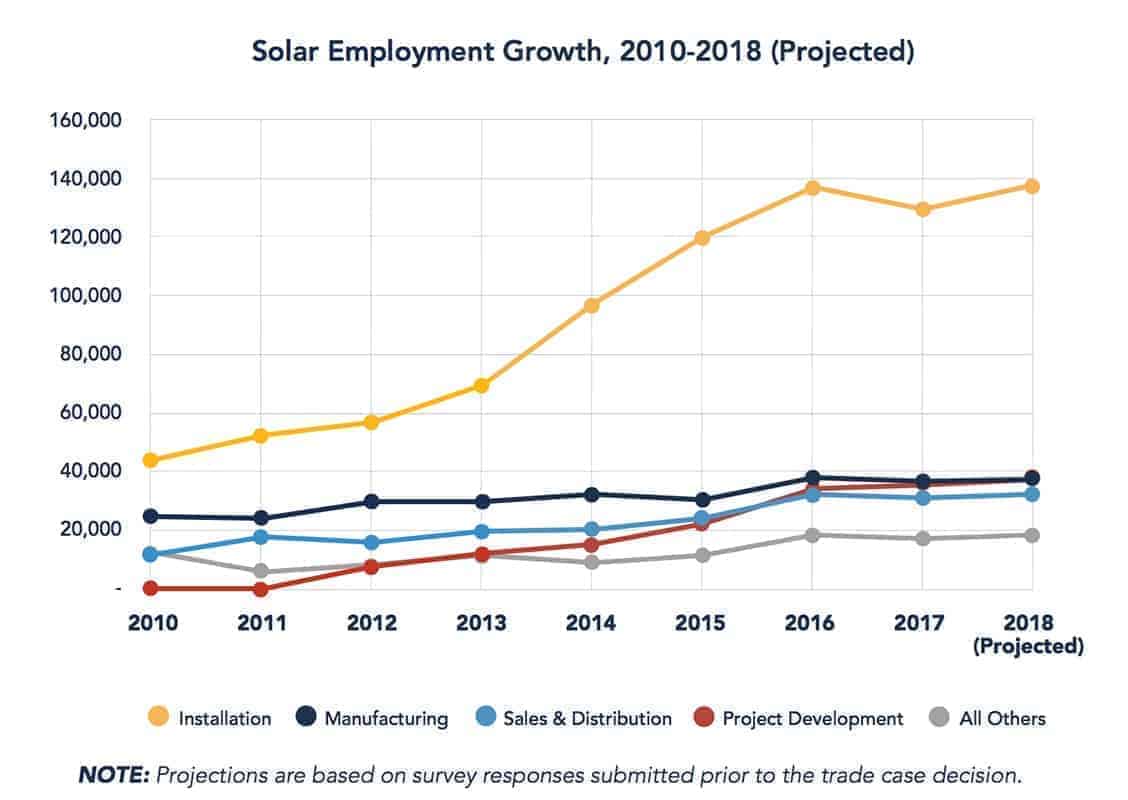
Solar employment declined slightly (3.8%) in 2017, but long-term trends in job growth are promising; since 2010, solar employment has grown by 168% and growth is expected again in 2018 (though the impacts of the recent trade case are still yet to be seen). Source: The Solar Foundation’s National Solar Jobs Census 2017 .
Discussing outlook for the future, The Solar Foundation’s Ed Gilliland noted that “We will likely experience some headwinds over the next year or two, but certainly the stronger states can sail forward. I think we can still get some emerging states to do well, but they need strong policies to support growth.”
For updates on solar policy changes around the country and other insights for your solar career, subscribe to the Aurora Blog!